
Three Gamblers and Time: illustration from Chaucer's Pardoner's Tale.
https://www.britishmuseum.org/collection/object/P_1865-0520-841
Corona: A financial pandemic in three acts
It’s been extremely difficult to gain a sense of perspective in the last two months and it’s my hope in the following essay to offer some meaningful comment and help you plan your economic future. Some of it is upsetting, some of it hopeful; there are no easy answers.
The events of the past few months have been dramatic, tragic, and massively disruptive.
We are in the midst of a natural biological disaster with some man-made consequences. This is a most intense and public example of decision making in real time. Modern decisions are usually made with reams of data and sophisticated modelling but what about when there’s no data, misleading data, false data, or no previous precedent? How can battlefield-type decisions be made when the enemy is invisible?
Time for some real human ingenuity.
This drama is unfolding in three acts. The Prelude, Crisis, and Healing. You’ve lived through the first two acts so I’ll give a general timeline and you can fill in the dramatic flourishes on your own. The issue at hand is regarding the pace of healing.
Act One: Prelude
Jan 11th. Chinese media reports first death from mysterious virus originating in Wuhan. The S&P 500 closes at 3265.
Feb 11th. Covid-19 (coronavirus disease 19) is given a rather bland name by the WHO. S&P 500 closes 3357.
Feb 14th. First European Covid-19 death. S&P 3380.
Feb 29th. First Covid-19 death in the United States. S&P 3090.
March 3rd: Jerome Powell and the Fed respond to market jitters by unexpectedly and immediately reducing interest rates 50 basis points. S&P 3003.
Act Two: Crisis
March 7th. Saudi Arabia responds to Russia’s bad attitude in Vienna by announcing their intention to flood the crude oil market and completely unhinge OPEC+. Monday the US crude oil benchmark (WTI) loses 25% of its value in a single day and global stock markets plummet. The SP500 ends down 7.5% at 2746.
March 13th. The US President declares a National Emergency. S&P 2711.
March 15th: The US quarantine begins. In a costume change for the ages, the Federal Reserve takes on super-hero qualities and unleash a monsoon, flooding debt markets with liquidity. They reduce the discount rate to zero and announce an alphabet soup of programs to effectively support every bond market in America (even junk bond ETF’s….) as well as opening facilities with foreign central banks to provide dollar financing globally. The S&P closes at 2386, 64 days after the first reported viral death in China and 27% below that first day’s closing price.
Note: In ten years’ time the actions of the Fed will be viewed in financial circles like a Henrik Lundqvist kick save in Game 7 of the Stanley Cup with three seconds on the clock to seal a New York Rangers victory; for non-hockey folks that’s the stuff of legends. The Fed’s actions were split-second in central bank terms, decisive, comprehensive, and without which the financial markets would now be truly staring into the abyss.
But in the words of Diane Swonk, Chief Economist at Grant Thornton, the Federal Reserve is a “Lender not a Spender”*.
Enter Spender.
March 23rd. As Robin to the Fed’s Batman, the US Government leaps into action and debates the CARES act. At many points it may have appeared that Robin has his shoelaces tied together as Congress stumbles towards an agreement. On March 22nd the failure of a procedural vote causes markets to hit ‘limit down’ overnight. Making sausage is not pretty. The S&P has its lowest close at 2237.
There is a saying, “Markets stop panicking when politicians start to panic”.** Congress gets the message of the market and negotiates.
March 27th. Congress passes the CARES act. The agreed bill is truly massive and highly supportive.
Since the passage of CARES, the S&P 500 has moved 39% higher from its low close of 2237 on March 23rd. The crisis of financial implosion was averted. Now begins the third act of economic healing. The damage as you will see is extensive. The curatives put in place are extensive as well. The question is, ‘is it enough’?
Act Three: Healing
This act is just starting, and the decisions made in the next few months will determine the economic path for the next decade or more. Seriously.
So, where are we now?
Simply put, we are in a Federally mandated economic depression (or close to a depression) instituted in response to a public health emergency. Ash Alankar of Janus Henderson described the current state of affairs as ‘a race between viral containment and bankruptcy’.*** Dramatic, but not inaccurate.
There are two main economic issues here:
- Liquidity: is there available cash or credit to cover short term obligations for all economic entities (persons, families, companies, and governments).
- Solvency: can each economic entity operate as a going concern into the future, generating the cash flow it needs to survive and thrive?
Liquidity is a short-term issue, solvency is long-term question. The Federal Reserve takes the lead on liquidity support, the Legislature and Executive branches take the lead on solvency support. Have they performed on their mandates?
Financial liquidity starts with properly functioning markets; this is where companies and governments can issue debt and help fund normal operations.
What is the state of financial markets?
The Federal Reserve Bank of St Louis Stress Index is a good single-picture summary on health of markets; it measures different yield spreads and interest rates and combines them in index. Our current century is shown below:
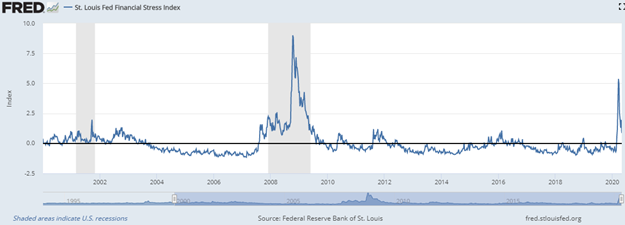
Federal Reserve Bank of St. Louis, St. Louis Fed Financial Stress Index [STLFSI2], retrieved from FRED, Federal Reserve Bank of St. Louis; https://fred.stlouisfed.org/series/STLFSI2, May 7, 2020.***
The first grey area above is 2001. The second grey area is the 2008 financial crisis. Notice that the 2008 crisis evolved over a course of 18 months. Thus far this drama has happened over the course of 8 weeks.
The financial stress graph is magnified below to show the past 12 months. Notice how quickly the actions of the Federal Reserve took hold and brought some level of order back to the market.
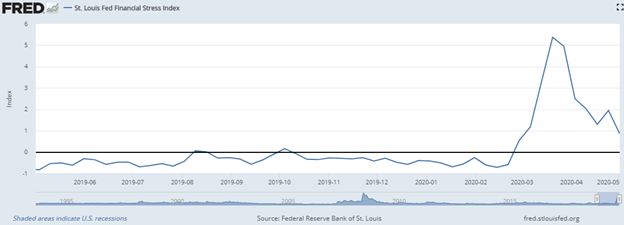
Federal Reserve Bank of St. Louis, St. Louis Fed Financial Stress Index [STLFSI2], retrieved from FRED, Federal Reserve Bank of St. Louis; https://fred.stlouisfed.org/series/STLFSI2, May 7, 2020.****
So financial markets are operating and there is massive Fed supplied liquidity. What about the condition of the general economy?
Nope.
There are a slew of graphs and economic measures showing the extent of the economic downturn, I’ll just show one.
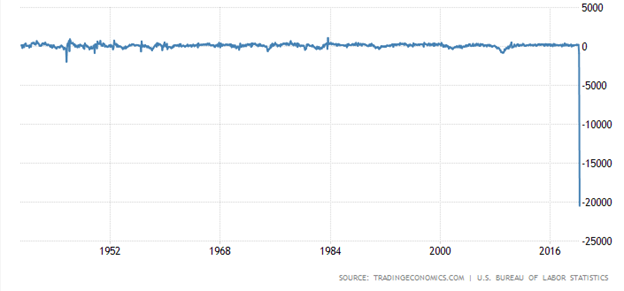
Below is a graph of the monthly change in United States Non-Farm Payrolls since 1939 (yes, eighty-one years of data). The current economy has stopped. Over 20 million people who had a job in March are not working.
United States Non-Farm Payrolls, monthly 1939-2020
What is being done to counter this unreal looking graph?
Is there a parallel to compare this economic full stop and through that glean some path forward?
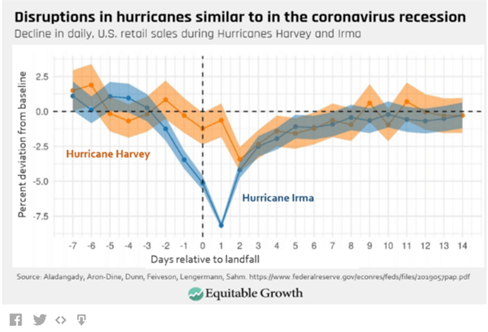
Claudia Sahm is an expert in recession economics. She is a Director of Macroeconomic Policy at the Washington Center for Equitable Growth and was a Senior Economist for the Federal Reserve Board of Governors. Mrs. Sahm likens the coronavirus disruption to a hurricane, below she shows the change in retail sales in regions affected by hurricanes*****:
And what happens after a hurricane? In rolls massive government support and a complete rebuilding of communities. That is exactly what is happening globally. Economic activity is being replaced by government support globally. And this is the way liquidity is entering the whole economic system.
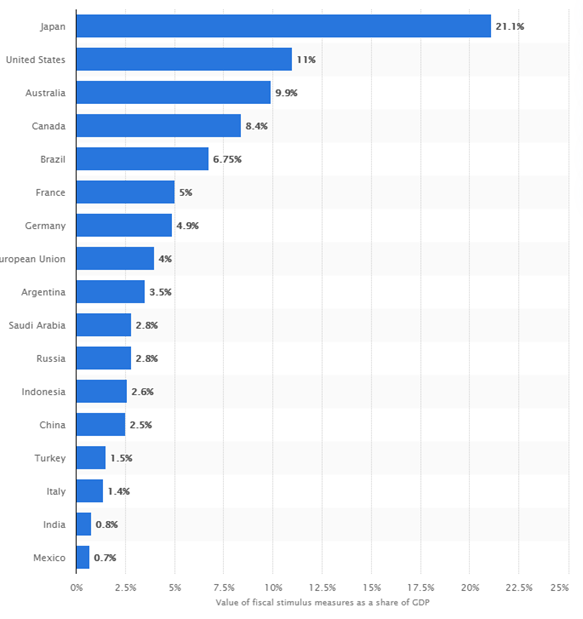
Value of COVID-19 fiscal packages in G20 countries as of April 2020, as a share of GDP
Details: Worldwide; April 2020
© Statista 2020
The CARES act and related bills contain provisions to distribute 11% of yearly US economic output (Gross Domestic Product) in support of the economy and its citizens. There is more legislation currently being negotiated that may increase that number to 15% of GDP or more. Japan is firing out 21% of its’ GDP and Europe collectively is spending 15.3%. These numbers are surreal.
For some perspective, consider the Marshall Plan. In 1948 the US government provided approximately $17 billion to aid European allies to reconstruct their war-torn countries. That year US GDP was $275 billion. The Marshall Plan was 6% of US Gross Domestic Product. The Corona support bills are currently twice that.
And remember that by 1952, only four years later after the Marshall plan began, participating Euro-countries had GDP’s higher than when they entered the war. The Marshall Plan gave the opportunity for Europe to embark on a period of massive growth. It’s not unreasonable to consider this a global Marshall Plan.
I cannot predict if the CARES act will do likewise but the potential is there. In contrast to WWII or Hurricane Irma, our productive capacity is intact and ready to go once the all clear is given.
Remember, contrary to what the press likes to say, these are meant to be support programs, not stimulus programs but there is a delta here that is crucial. The argument can be made that if the upcoming GDP numbers show a downturn of say 10% and the US government provides 15% of GDP in support, that is highly stimulative. In fact the 5% differential would be twice the growth rate of the pre-virus economy. Did anyone say inflation? This is a possibility, but future GDP is opaque and so is future government spending.
The single greatest variable is currently unknowable, when is it safe to start living life again and will this virus return?
And this is also the answer to the second issue, one of solvency; I wish I had an answer regarding future solvency but no one really knows. This is the battle being fought in financial markets currently.
But if humans are given the opportunity to innovate, cooperate, and participate we may look back on the year 2020 as revolutionary.
Things to consider:
- Watch Congress
- If more support programs are introduced that’s a good thing, if haggling about spending starts and infighting leads to another ‘no’ vote like the one on March 22nd, we have a problem. Market reaction could be severe.
- If Congress keeps rolling out programs, the equity rally will continue. Equities love the cash flow, bonds hate the fact that balance sheets are looking ugly.
- The Tax Cuts and Jobs act of 2017 has sunset provisions and the odds of the tax breaks extending are zero. Taxes will go up.
- For businesses, full expensing of equipment will phase out at the end of 2022.
- For individuals, 23 provisions of the act will expire at the end of 2025.
- The Federal Reserve is now officially the Central Bank to the World.
- Interest rates will stay extremely low for years because global central banks and their economies are tied to the dollar and the world economy would not tolerate Fed rate raising.
- Note: 70% of all global transactions settle in USD every day. The world needs dollars to function.
- The US dollar will be unusually strong, making foreign goods cheaper and US goods more expensive to the world.
- Emerging markets will struggle to find funding and will be squeezed out of the race for dollars by the safer credit of more developed countries.
- Interest rates will stay extremely low for years because global central banks and their economies are tied to the dollar and the world economy would not tolerate Fed rate raising.
- Stuff will get more expensive.
- Supply chains will have to be redesigned to be less ‘just in time’ and foreign to more resilient and local. That adds costs to just about everything.
- Globalization and open trade is dead (at least with one particular country).
- Regardless of who is elected, the relationship with China is undergoing a complete reappraisal.
- A mutli-polar world is possible, with a centralized hegemonic system originating from the East and a decentralized highly dynamic system in the West.
- Read this for perspective, Samuel P Huntington, Clash of Civilizations. Written 25 years ago and still pertinent today.
- The pharmaceutical industry may be entering a golden age
- The techniques being force fed into the search for a vaccine will change how drugs are developed, manufactured, and most importantly, how they are regulated.
- Pray that Congress passes an infrastructure bill; we need it. That will be a major factor in US productivity and competitiveness over the next 50 years.
- Gold has remained a store of value for 10,000 years.
- The supply of gold increases 1% per year on average.
- In the US alone, dollar money supply is increasing by 20%, global currency supply is ballooning in concert.
- Which would you rather hold as a long-term store of value, currencies or something tangible?
- Yes, bitcoin has a limit in terms of supply. It is also 12 years old. Digital currency is an amazing experiment. Will bitcoin be a store of value or will another coin take precedent? I do not know and my job is not to experiment, yet.
- The problem of solvency will be played out over a course of years. The immediate challenge is one of liquidity and that is being met.
- Companies with a lot of cash on their balance sheet have a competitive advantage currently with a lower level of operational stress.
- The debate on the explosion of government balance sheets and solvency is just beginning but needs to take a backseat to the immediate need of supporting populations.
- The way we live our lives may change, but people will want to go into the office to collaborate (but maybe not every day), we will go to restaurants but may walk out of a crowd, younger people will feel invincible and will still go to concerts, and we’ll still go to the occasional movie. This problem will get solved.
I enjoy working with clients who want to understand their finances and be actively involved in shaping their future. Please contact me if you have any questions or comments.

Brian Kearns, CPA
Haddam Road Advisors
Financial Planner / Portfolio Manager
1603 Orrington Ave
Suite 600
Evanston, IL 60201
Ph: 312 636 3067
www.haddamroad.com
NOTE: This is being provided for informational purposes only and should not be construed as a recommendation to buy or sell any specific securities. Past performance is no guarantee of future results and all investing involves risk. Index returns shown are not reflective of actual performance nor reflect fees and expenses applicable to investing. One cannot invest directly in an index. The views expressed are those of Haddam Road Advisors and do not necessarily reflect the views of Mutual Advisors, LLC or any of its affiliates.
Investment advisory services offered through Mutual Advisors, LLC DBA Haddam Road Advisors, a SEC registered investment adviser.
* Bloomberg April 28th, 2020.
** Bloomberg March 13th, 2020.
***Bloomberg Surveillance March 16, 2020
****Source: Federal Reserve Bank of St. Louis
Release: St. Louis Fed Financial Stress Index
Units: Index, Not Seasonally Adjusted
Frequency: Weekly, Ending Friday
The STLFSI2 measures the degree of financial stress in the markets and is constructed from 18 weekly data series, all of which are weekly averages of daily data series: seven interest rates, six yield spreads, and five other indicators. Each of these variables captures some aspect of financial stress. Accordingly, as the level of financial stress in the economy changes, the data series are likely to move together.
How to Interpret the Index:
The average value of the index, which begins in late 1993, is designed to be zero. Thus, zero is viewed as representing normal financial market conditions. Values below zero suggest below-average financial market stress, while values above zero suggest above-average financial market stress.
***** https://equitablegrowth.org/the-coronavirus-recession-is-severe-and-the-damage-to-the-u-s-economy-will-last-years/
- April 2025 (4)
- March 2025 (2)
- February 2025 (1)
- January 2025 (8)
- December 2024 (1)
- November 2024 (8)
- October 2024 (6)
- September 2024 (1)
- December 2023 (1)
- November 2023 (1)
- October 2023 (1)
- August 2023 (1)
- May 2022 (1)
- February 2022 (1)
- September 2020 (1)
- August 2020 (2)
- June 2020 (1)
- February 2020 (1)
- January 2020 (1)
- December 2019 (4)
- November 2019 (2)
- October 2019 (1)
Subscribe by email
You May Also Like
These Related Insights

Haddam Road in the News: Capitol City Now

Haddam Road in the News: Insight Magazine


